HubSpot Reports You Should be Using Today
If you’re a HubSpot user, you probably already know that the tool offers countless capabilities to help streamline your marketing efforts. From landing page creation to CRM functionality, the platform helps support and run the digital marketing and sales functions for any business.
But what’s the point in putting so much effort into a program if you’re not reporting on its success? That’s where HubSpot reports come in. These reports help you to evaluate your overall marketing and sales progress so you can continue optimizing and get the most out of your efforts.
What Can HubSpot Reports Track?
HubSpot tracks activity throughout every component included in the tool. You can see how many people opened an email, viewed a landing page, filled out a form or clicked on a social post. You can then tie this activity to revenue, assuming you’re tracking your sales opportunities in HubSpot (or an integrated CRM, such as Salesforce) as well. Actively monitoring this information on a regular basis will help you draw conclusions about how each aspect of your program is performing, allowing you to adjust your approach accordingly – expanding on what’s working and changing direction on things that aren’t.
HubSpot’s reporting section allows you to create custom dashboards to tailor metrics according to what you want to see. While customizing reports is an option, there are multiple pre-existing reports built into the platform that are very useful, offering streamlined insight into your marketing efforts.
Whether you’ve just started using the platform or you’re looking to utilize the reporting and analytics tools more effectively, here are the top reports you should be monitoring in your HubSpot account today.
Traffic Analytics
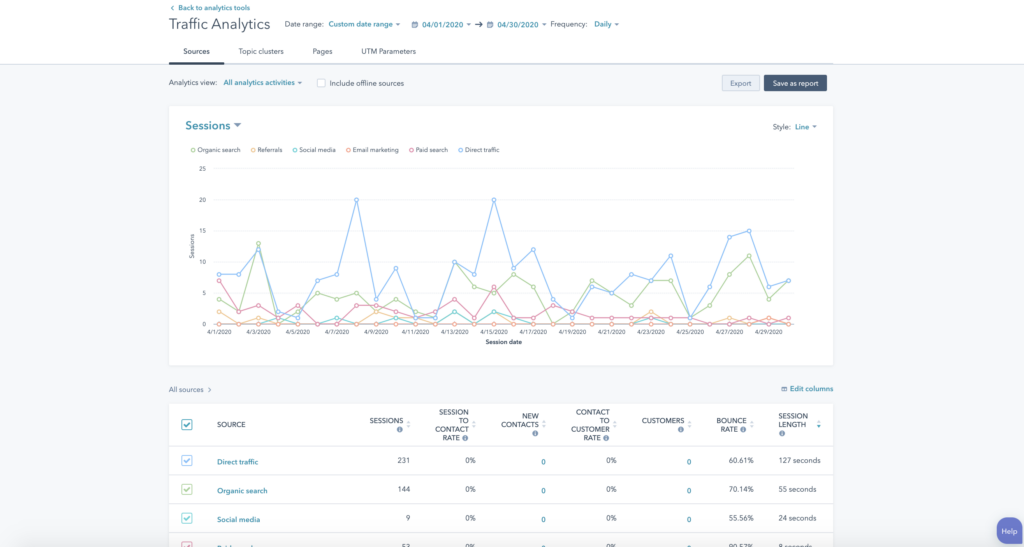
This is a robust default HubSpot report that allows you to review the types of traffic your site is receiving and where site visitors are coming from. The report opens up to the sources tab by default. This shows you exactly how visitors are getting to your site – via organic search, social media, email, etc. – and how that traffic translates into lead funnel data like contacts and customers. Drilling down into each source reveals more information about those contacts.

The second most important place to look on this report is the Pages tab. Here you can see which pages had the most views during the selected period of time, and how that traffic translates into HubSpot contacts and customers. This is important to monitor in order to see how your content is performing, specifically for pages that you’re using explicitly for lead generation, such as landing pages for PPC campaigns or pages with contact forms.
The UTM tab on this report is useful for campaign tracking. Analyzing the activity from UTM-tagged campaigns offers more in-depth insight into how a campaign is performing, beyond just the high-level source. Here you’ll be able to directly draw connections between a campaign and your new HubSpot contacts and customers, proving which campaigns are successful and which require more focus.
Dashboard Reports
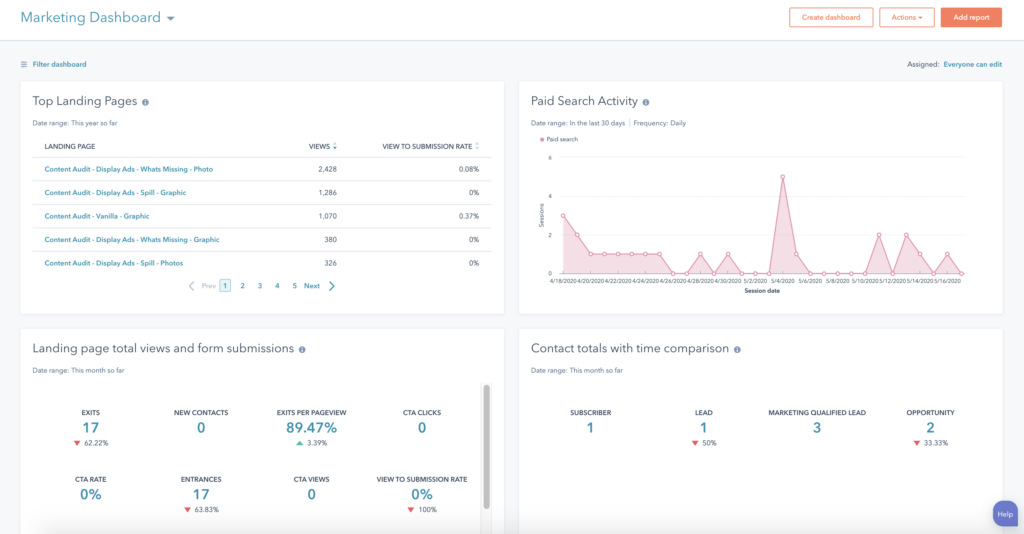
Beyond what HubSpot offers by default in the Analytics Tools section, Dashboards can be a valuable resource for monitoring performance of multiple efforts across your HubSpot account. Within the Marketing Dashboard, there are several important reports you can add to see certain account activity at-a-glance.

Here are some standard, pre-built reports we suggest using to get you started:
- CMS Performance: This report gives a quick snapshot of the most important performance data from your HubSpot-hosted pages, which may include landing pages, blog posts or your entire site, depending on what’s built on HubSpot. If your main site is hosted somewhere other than HubSpot, we recommend changing the report name to HubSpot Content Performance, so it’s easy to separate from the rest of your webpages. This is all your HubSpot activity at a glance. Use this to see what’s happening daily, and monitor monthly trends in your content.
- Contact Created Totals by Source: This report shows the number of total contacts and their original source, such as PPC or organic search. This gives valuable insight into where your traffic is coming from, and where you may need to focus more of your efforts.
- Session Totals by Day with Source Breakdown: This report shows sessions over time, split out by traffic source. Use it to get an idea of which channels visitors are going through to land on your site, and how those visitors are interacting with your content.
- Landing Pages by Most Total Views: Find your top performing landing pages by seeing which ones are getting the most views. Use this information to understand what’s working and what’s not, while seeing the conversion rate at which contacts view your landing page before becoming customers.
- Session Totals with Percentage of New and Mobile Sessions: This report shows various metrics that give a high-level view of how visitors are interacting with your site. You can see the total number of sessions on your site and how many of those sessions are from first-time visitors. Use it to get a sense of how much traffic is coming from new visitors, or how much traffic is from mobile devices. You can use this information to adjust your marketing strategies and your site development priorities.
- Website Visitor Engagement Rates: This report shows you how site visitors are engaging with your content through several metrics. It also shows the traffic sources for each of these engagement numbers. Use it to see things like bounce rate and average page views per session.
- Email Sent Totals with Engagement Rates: Know exactly how your emails are doing during a selected date range. Track sends, clicks, opens, and click rate, and use this information to optimize future emails and improve your email performance.
- Social Interactions by Network: In this report, you can see the number of likes, reactions and comments for your published social media posts. This also includes posts that were published to your connected accounts outside of HubSpot. Use this to see what content is the most engaging with your different social audiences.
HubSpot’s reporting tools also offer the ability to create more robust custom reports to use in tandem with these standard ones. One thing to remember: No matter which report you’re using, be sure to select the appropriate date range. It’s valuable to use these reports on a regular basis in order to effectively measure performance month-over-month.
And remember, reporting tools capture the data and display it in an easy-to-understand format, but you’re the one who will have to connect the dots and draw conclusions to make the important marketing decisions based on the findings!
If you have any questions about HubSpot reports and marketing performance analysis, please reach out to us! We’d be happy to help get you started.


